US Budget 2014-2025
The federal budget deficit, which has fallen sharply during the past
few years, is projected to hold steady relative to the size of the
economy through 2018. Beyond that point, however, the gap between
spending and revenues is projected to grow, further increasing federal
debt relative to the size of the economy—which is already historically
high.
Those projections by CBO, based on the assumption that current laws
governing taxes and spending will generally remain unchanged, are built
upon the agency’s economic forecast. According to that forecast, the
economy will expand at a solid pace in 2015 and for the next few
years—to the point that the gap between the nation’s output and its
potential (that is, maximum sustainable) output will be essentially
eliminated by the end of 2017. As a result, the unemployment rate will
fall a little further, and more people will be encouraged to enter or
stay in the labor force. Beyond 2017, CBO projects, real
(inflation-adjusted) gross domestic product (GDP) will grow at a rate
that is notably less than the average growth during the 1980s and 1990s.
Rising Deficits After 2018 Are Projected to Gradually Boost Debt Relative to GDP
CBO estimates that the deficit for this fiscal year will amount to
$468 billion, slightly less than the deficit in 2014 (see the table
below). At 2.6 percent of GDP, this year’s deficit is projected to be
the smallest relative to the nation’s output since 2007 but close to the
2.7 percent that deficits have averaged over the past 50 years.
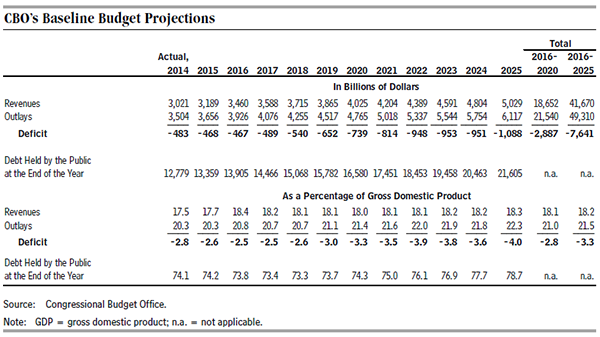
Although the deficits in CBO’s baseline projections remain roughly
stable as a percentage of GDP through 2018, they rise after that. The
deficit in 2025 is projected to be $1.1 trillion, or 4.0 percent of GDP,
and cumulative deficits over the 2016–2025 period are projected to
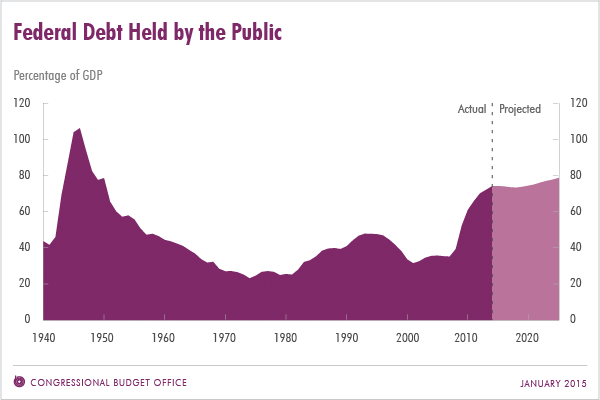
total $7.6 trillion. CBO expects that federal debt held by the public
will amount to 74 percent of GDP at the end of this fiscal year—more
than twice what it was at the end of 2007 and higher than in any year
since 1950 (see figure below). By 2025, in CBO’s baseline projections,
federal debt rises to nearly 79 percent of GDP.
Outlays
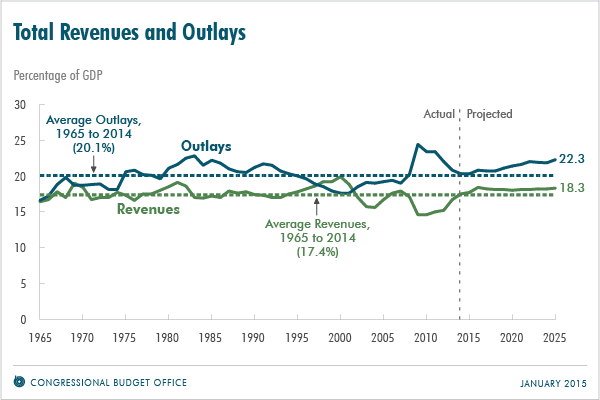
In CBO’s projections, outlays rise from a little more than 20 percent
of GDP this year (which is about what federal spending has averaged
over the past 50 years) to a little more than 22 percent in 2025 (see
figure below). Four key factors underlie that increase:
- The retirement of the baby-boom generation,
- The expansion of federal subsidies for health insurance,
- Increasing health care costs per beneficiary, and
- Rising interest rates on federal debt.
Consequently, under current law, spending will grow faster than the
economy for Social Security; the major health care programs, including
Medicare, Medicaid, and subsidies offered through insurance exchanges;
and net interest costs. In contrast, mandatory spending other than that
for Social Security and health care, as well as both defense and
nondefense discretionary spending, will shrink relative to the size of
the economy. By 2019, outlays in those three categories taken together
will fall below the percentage of GDP they were from 1998 through 2001,
when such spending was the lowest since at least 1940 (the earliest year
for which comparable data have been reported).
Revenues
Revenues are projected to rise significantly by 2016, buoyed by the
expiration of several provisions of law that reduced tax liabilities and
by the ongoing economic expansion. In CBO’s projections, based on
current law, revenues equal about 18½ percent of GDP in 2016 and remain
between 18 percent and 18½ percent through 2025. Revenues at that level
would represent a greater share of the economy than their 50-year
average of about 17½ percent of GDP but would still be less than outlays
by growing amounts over the course of the decade. Revenues from the
individual income tax are expected to rise relative to GDP—mostly
because people’s income will move into higher tax brackets as income
gains outpace inflation, to which those brackets are indexed. But those
increases are expected to be offset by reductions relative to GDP in
revenues from the corporate income tax and other sources.
Changes From CBO’s Previous Budget Projections
The deficit that CBO now estimates for 2015 is essentially the same
as what the agency projected in August. CBO’s estimate of outlays this
year has declined by $94 billion, or about 3 percent, from the August
projection because of a number of developments, including
higher-than-expected receipts from auctions of licenses to use the
electromagnetic spectrum for commercial purposes. But CBO’s estimate of
revenues has dropped almost as much—by $93 billion, also about 3
percent—mostly because of the enactment of legislation that
retroactively extended a host of expired tax provisions through December
2014.
Over the 2015–2024 period, deficits are now projected to total about
$175 billion less than CBO’s August estimate for that period. The
current projections of revenues and outlays for those years are both
lower than previously estimated, outlays a little more so.
The Longer-Term Outlook
When CBO last issued long-term budget projections (in July 2014), it
projected that, under current law, debt would exceed 100 percent of GDP
25 years from now and would continue on an upward trajectory
thereafter—a trend that could not be sustained. (The 10-year projections
presented here do not materially change that outlook.) Such large and
growing federal debt would have serious negative consequences, including
increasing federal spending for interest payments; restraining economic
growth in the long term; giving policymakers less flexibility to
respond to unexpected challenges; and eventually heightening the risk of
a fiscal crisis.
The Economy Will Grow at a Solid Pace Over the Next Few Years
CBO anticipates that, under current law, economic activity will
expand at a solid pace in 2015 and over the next few years—reducing the
amount of underused resources, or “slack,” in the economy.
Economic Growth Over the Next Few Years
In CBO’s estimation, increases in consumer spending, business
investment, and residential investment will drive the economic expansion
this year and over the next few years. The growth in those categories
of spending will derive mainly from increases in hourly compensation,
rising wealth, the recent decline in crude oil prices, and a step-up in
the rate of household formation (as people are more willing and able to
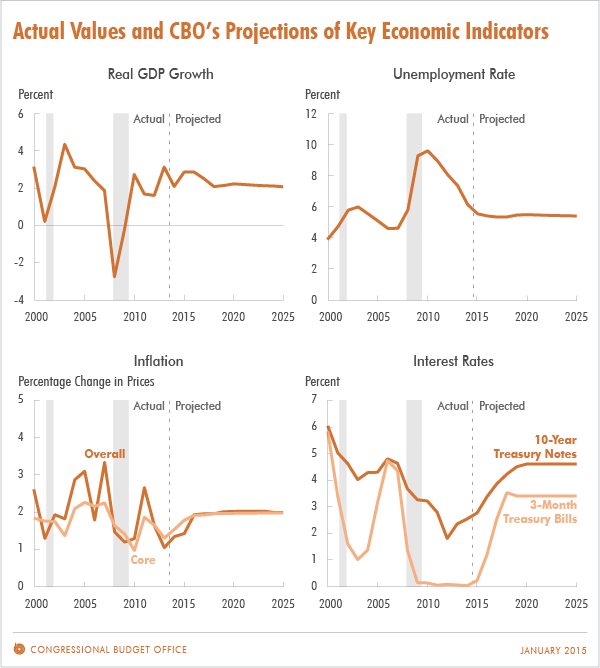
set up new homes). As measured by the change from the fourth quarter of
the previous year, real GDP will grow by about 3 percent in 2015 and
2016 and by 2½ percent in 2017, CBO expects (see figure below).
The Degree of Slack in the Economy Over the Next Few Years
The difference between actual GDP and CBO’s estimate of potential
GDP—which is a measure of slack for the whole economy—was about 2
percent of potential GDP at the end of 2014. During the next few years,
CBO expects, actual GDP will rise more rapidly than its potential,
gradually eliminating that slack. For the labor market in particular,
CBO anticipates that slack will dissipate by the end of 2017. By CBO’s
projections, increased hiring will reduce the unemployment rate from 5.7
percent in the fourth quarter of 2014 to 5.3 percent in the fourth
quarter of 2017, which is close to the expected natural rate of
unemployment (that is, the rate arising from all sources except
fluctuations in the overall demand for goods and services). That
increased hiring will also encourage more people to enter or stay in the
labor force, boosting the labor force participation rate (which is the
percentage of people who are working or actively looking for work).
Economic Growth in Later Years
The agency’s projections beyond the next few years are not based on
estimates of cyclical developments in the economy, because the agency
does not attempt to predict economic fluctuations that far into the
future; instead, those projections are based on estimates of underlying
factors that affect the economy’s productive capacity.
For 2020 through 2025, CBO projects that real GDP will grow by an
average of 2.2 percent per year—a rate that matches the agency’s
estimate of the potential growth of the economy in those years.
Potential output is expected to grow much more slowly than it did during
the 1980s and 1990s primarily because the labor force is anticipated to
expand more slowly than it did then. Growth in the potential labor
force will be held down by the ongoing retirement of the baby boomers;
by a relatively stable labor force participation rate among working-age
women, after sharp increases from the 1960s to the mid-1990s; and by
federal tax and spending policies set in current law.
Inflation and Interest Rates
The elimination of slack in the economy will eventually remove the
downward pressure on the rate of inflation and on interest rates that
has existed for the past several years. By CBO’s estimates, the rate of
inflation as measured by the price index for personal consumption
expenditures will move up gradually to the Federal Reserve’s goal of 2
percent, hitting that mark in 2017 and beyond. Interest rates on
Treasury securities, which have been exceptionally low since the
recession, will rise considerably in the next few years, CBO expects,
but remain lower than they were, on average, in previous decades.
Between 2020 and 2025, the projected interest rates on 3-month Treasury
bills and 10-year Treasury notes are 3.4 percent and 4.6 percent,
respectively.
Changes From CBO’s Previous Economic Projections
Last August, CBO projected real GDP growth averaging 2.7 percent per
year for 2014 through 2018; CBO now anticipates that real GDP growth
will average 2.5 percent annually over that period. The revision mainly
reflects a reduction in CBO’s estimate of potential output and therefore
of the current amount of slack in the economy. On the basis of the
current projection of potential output, CBO now forecasts that real GDP
in 2024 will be roughly 1 percent lower than the level estimated in
August. In addition, the sharper-than-anticipated drop in the
unemployment rate in the second half of last year caused CBO to lower
its projection of that rate for the next few years.
( courtesy- www.cbo.gov)


.JPG)


